
A great lesson plan for 2nd grade needs to do more than just check off a list of standards. It has to pull kids in, connecting learning to their world in a way that feels like pure fun. That’s exactly what this guide delivers: a complete, 45-minute lesson that uses the magic of storybook characters to introduce graphing and data skills.
Your Go-To Lesson Plan for Data and Storytelling
Let’s be honest, abstract math worksheets aren't always the most exciting part of the day. The best lessons find a way to make learning feel personal and immediate. This plan transforms a core math concept—data collection—into a storytelling adventure.
Instead of just counting colored blocks, second graders get to survey their friends about their favorite book characters. Suddenly, those abstract numbers tell a real story about what their own classroom loves. It’s a simple shift, but it makes all the difference.
This approach is also a fantastic cross-curricular tool. It hits key math standards while naturally reinforcing literacy skills. By anchoring the activity in familiar stories and characters, you’re tapping into something students already care about, making the entire learning process stick.
Lesson Plan at a Glance
Here is a quick overview of what this lesson plan covers, from core objectives to the final assessment.
| Component | Description |
|---|---|
| Lesson Focus | Collecting, representing, and interpreting data using tally charts and graphs. |
| Grade Level | 2nd Grade |
| Time Allotment | 45 Minutes |
| Core Subjects | Mathematics, Language Arts |
| Key Vocabulary | Survey, data, tally mark, bar graph, pictograph, analyze. |
| Learning Objectives | Students will be able to collect data through a class survey, organize data using tally marks, and create a bar graph or pictograph to represent the data. |
| Materials | Chart paper/whiteboard, markers, sticky notes or small paper squares, pencils, graph paper. |
| Assessment | Informal observation of student participation and review of their completed graphs. |
This table lays out the roadmap, but the real magic happens when you bring it to life in your classroom.
What Makes This Lesson Plan Work
I've found that the lessons that truly resonate are structured, relevant, and respect a teacher's busy schedule. This one is designed to be a grab-and-go resource that maximizes engagement without requiring a weekend of prep. Here’s why it’s so effective:
- Standards-Aligned: It directly addresses key second-grade math standards for representing and interpreting data.
- Engaging Theme: It uses the power of storytelling to make math exciting. The characters could come from some of the best read aloud books for 2nd grade.
- Hands-On Activity: Kids are up and moving, conducting surveys, using tally marks, and building their own graphs. It’s active learning at its best.
- Minimal Prep: You probably have all the materials—chart paper, markers, sticky notes—in your classroom right now.
Think of this plan as more than just a set of instructions. It's really a framework for sparking genuine curiosity. When students realize that math helps them answer questions about their own world—like which book character is the class champion—they start to see numbers as a powerful tool for discovery.
If you’re looking for a deeper dive into structuring educational content, this guide to making a lesson plan that works provides a solid foundation for any subject.
Gathering Your Tools for a Data Adventure
The best lessons often use the simplest tools, and this data adventure is no different. Before we jump into this engaging lesson plan for 2nd grade, a little prep work will make sure everything runs smoothly. The good news? You probably have everything you need tucked away in your classroom cupboards already.
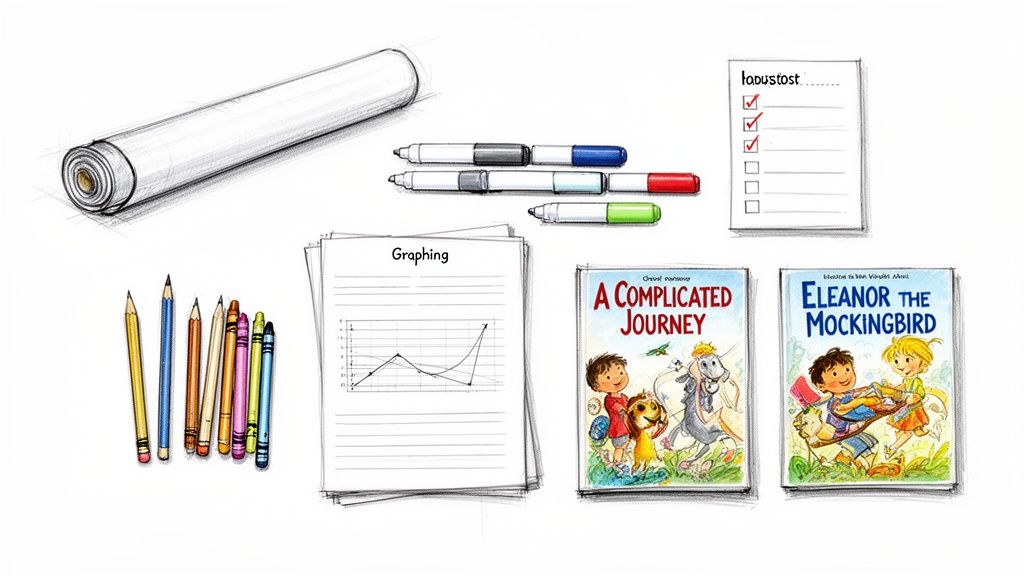
We’re going to be using common classroom staples that encourage big, visible thinking. You'll want a large surface for the whole group to brainstorm, like chart paper or your whiteboard, along with some colorful markers to really make the data pop.
For your students, it's even simpler. Each child just needs a pencil for making their tally marks and some crayons or colored pencils to bring their graphs to life. We’ll also give you a downloadable graphing worksheet to keep everything neat and tidy.
Essential Materials Checklist
To keep things organized, here's a quick rundown of what you’ll need to have on hand. Getting these items ready to go will make the transitions between activities seamless and keep the lesson’s momentum going.
-
For the Teacher:
- One large sheet of chart paper or access to a whiteboard.
- A variety of colorful markers for brainstorming and modeling.
- A copy of our provided graphing worksheet for each student.
-
For Each Student:
- One sharpened pencil with an eraser.
- A small box of crayons or colored pencils.
- An engaged and curious mind, ready for fun!
Anchoring the Lesson with Beloved Stories
The real magic of this lesson comes from the stories you choose. Data suddenly feels much more important when it’s about characters your students know and love. Grab a few popular books from your classroom library to act as the foundation for your survey.
For example, you could poll the class on their favorite character from a book like A Complicated Journey or Eleanor the Mockingbird. This simple act connects abstract graphing skills to a shared, memorable story, making the learning experience far more powerful.
Having a well-organized reading corner makes it easy to find the perfect books for activities just like this. If you’re looking for inspiration on setting yours up, check out our guide on classroom library organization ideas.
Finally, take a look at your classroom layout. Since students will be surveying one another, a setup that allows for easy movement is ideal. This little bit of prep work sets the stage for a lesson where students don’t just learn about data—they get to experience it.
How to Run the Lesson From Start to Finish
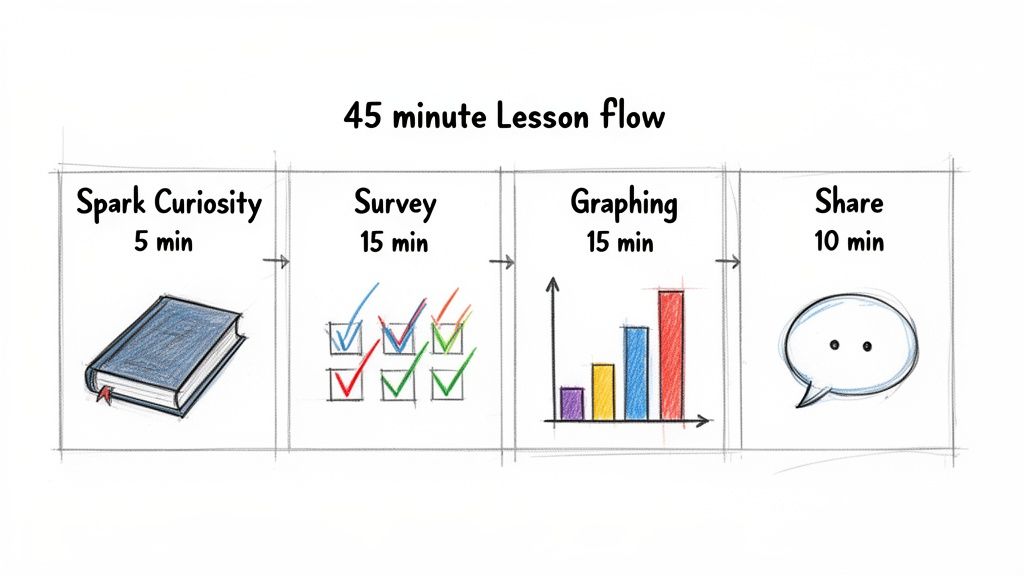
Alright, now for the fun part—bringing this lesson plan for 2nd grade to life in your classroom. I’ve broken the 45-minute block into a timed sequence that I've found really works. This structure isn't just about watching the clock; it’s designed to build momentum and keep your second graders hooked from beginning to end.
This play-by-play guide is filled with my favorite teacher prompts, what you might hear from students, and some classroom-tested tips. The goal is to create a dynamic discussion that feels more like a natural conversation than a lecture.
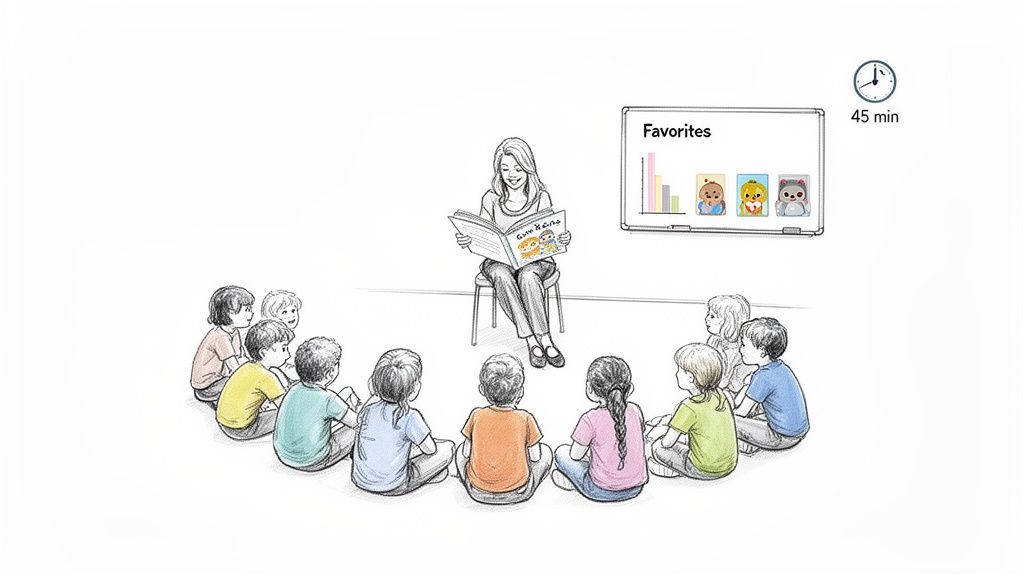
The First Five Minutes: Sparking Curiosity
Get things started by gathering your students on the carpet for a quick, compelling introduction. I love to kick things off by reading a short, character-rich part of a book like Eleanor the Mockingbird. You don't need the whole story, just a little snippet to get the main players back in their minds.
Then, you'll ask a simple, open-ended question.
- Teacher Prompt: "After hearing that part again, which character did you connect with the most? Whose feelings did you really understand?"
Let a few kids share their thoughts. This isn't about finding a "right" answer. It’s all about activating their personal connection to the story and getting them primed for the survey.
The Next Fifteen Minutes: Collecting Data
Now you’re ready to shift into the hands-on data collection. Announce that you're curious to see which character is the whole class's favorite. This is the perfect moment to introduce the concept of a survey.
On your whiteboard or a big piece of chart paper, list the main characters from the story. I always model how to use a tally mark to record a vote, saying something like, "Each little line, or tally, is like one person raising their hand."
Hand out clipboards with paper or small whiteboards and send them off to survey five to ten classmates. Remind them to use their tally marks to keep track. The room will get a little buzzy, and that’s a good thing! It's the sound of kids actively learning.
Teacher Tip: This is your time to walk around the room. Listen to their conversations and gently guide any students who might be a little stuck with the tallying. A quick, quiet prompt like, "Show me how you'd mark three votes for Eleanor," can work wonders.
This part of the lesson is so important for connecting an abstract skill (tallying) to a concrete action (asking a friend a question). It’s a method that works just about everywhere. Educational data shows that lessons using real-world information can seriously boost student engagement. When you weave math into reading—like graphing the results of a story survey—you turn abstract standards into something joyful and memorable. You can explore more about these educational findings and how they shape modern teaching.
The Following Fifteen Minutes: Graphing Our Findings
Once the surveys are done, bring everyone back together. It's time to turn all that raw data into a beautiful, easy-to-read graph.
Guide your students as they create a simple bar graph on their worksheets. You’ll want to model the process on the board, taking it one step at a time.
- Label the Axes: Show them how to write the character names along the bottom (the x-axis) and the number of votes up the side (the y-axis).
- Color the Bars: Ask, "How many votes did our first character get?" Count the tallies together as a class, then color in that many boxes on the graph.
- Repeat: Keep going for each character. I suggest using a different color for each bar to make the data pop and be easy to compare.
This is such a powerful moment. Your students get to see their individual tally marks come together to paint a clear picture of what the whole class thinks.
The Final Ten Minutes: Sharing and Discussing
You'll wrap up the lesson with a group discussion focused on what the graph tells you. This is where the real learning sticks. Display a few student graphs or use the one you all made together on the board.
Now, pose some questions that make them think.
- Which character got the most votes?
- Which one got the least?
- How many more votes did Character A get than Character B?
Challenge them to think about the "why" behind the numbers. A prompt like, "Why do you think so many of us chose that character?" can spark a rich conversation about character traits and story events, perfectly blending their math and literacy skills.
Assessing Student Understanding Without Formal Tests
How can you be sure the learning from your lesson plan for 2nd grade has really stuck without giving a formal quiz? The secret is to watch, listen, and use quick, low-stress checks that feel like a natural part of the classroom activity. This is where informal, observational assessment becomes your best friend.
Instead of a test, you’re simply gathering clues by being present and engaged. Pay attention to how your students tackle the task. Are they making tally marks with confidence? Do they see the connection between their tallies and the colored blocks on their graph? These little observations often tell you far more than a worksheet ever could.
A perfect moment for assessment comes during the final group share-out. When a student can proudly explain what their graph shows—"Our class likes Character A the most!"—they're showing you they get it. Their ability to spell out the main takeaway is a clear sign they’ve connected the dots from collecting data to understanding what it means.
Quick and Simple Comprehension Checks
You don’t need a complicated rubric to figure out who’s on track. A few simple, focused tools can give you a clear snapshot of student learning in just a few minutes. Best of all, these methods keep the pressure low and let the fun of discovery take center stage.
- Exit Tickets: Before they line up for recess, have students jot down one sentence on a sticky note answering, "What is the most important thing your graph tells us?" This gives you immediate, individual feedback.
- Think-Pair-Share: Pose a question like, "How could we use a graph like this to help our school?" Let them think for a moment, turn to a partner, and then ask a few pairs to share with the whole class. This quickly reveals who can apply the concept to a new situation.
- Thumbs Up, Thumbs Middle, Thumbs Down: This is a classic for a reason. Ask a simple question like, "Do you feel confident you could make another graph tomorrow?" You'll instantly see who might need a little extra support from you.
The real goal here isn't to assign a grade. It’s about informing your next move as a teacher. By seeing where your students are, you can adjust your plans, offer targeted help, or provide a new challenge to keep everyone engaged and learning.
Meeting Every Learner Where They Are
Every classroom is filled with a wide range of learners, and differentiation is the key to making sure every single student feels successful. This lesson plan was built to be flexible, allowing you to easily dial the complexity up or down to meet individual needs. Your observations will be your guide for deciding which strategies to pull out of your toolkit.
For students who could use a little more scaffolding, giving them a pre-labeled graph template can be a total game-changer. It removes the hurdle of setting everything up and lets them focus entirely on moving their data onto the graph. You can learn more about spotting specific needs by exploring ways to assess reading level, as many of the same observational skills apply here.
For those students who are ready for a bigger challenge, push their thinking with some extension questions. Ask them to make comparisons, like "How many more votes did Eleanor get than the other characters combined?" This takes them beyond just showing data and into the world of deeper analysis. Helping students master this transition is crucial; research shows that students proficient in these skills tend to score 20% higher on long-term math assessments. You can read the full study about these educational findings for more detail.
Extending the Lesson with Cross-Curricular Activities
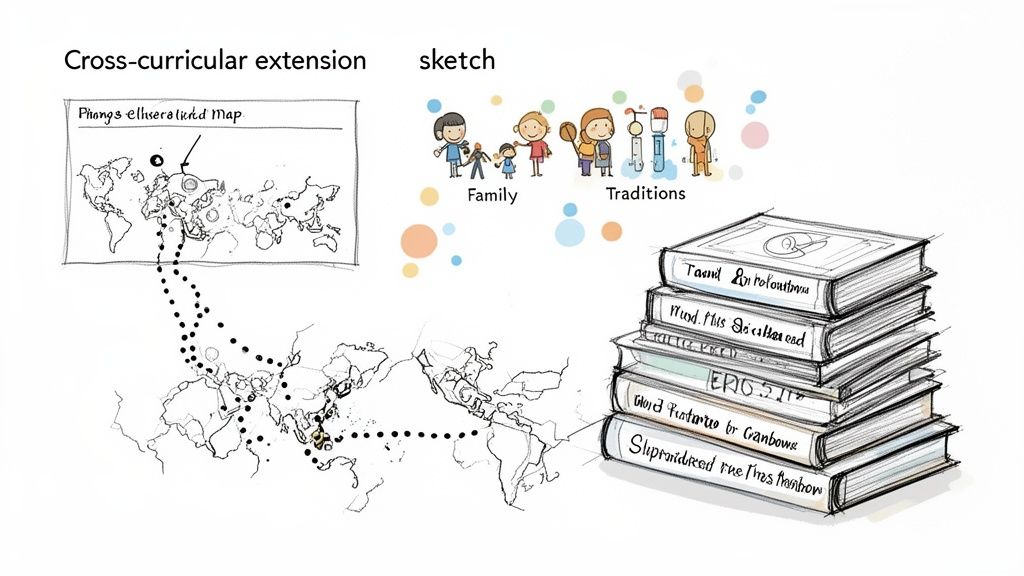
A great math lesson doesn't have to end just because the math block is over. When you weave data collection into other subjects, you can turn a single activity into a much richer, more memorable learning experience. The stories from Number 6 Publishing are perfect springboards for this.
This isn't just an add-on; it truly deepens comprehension in both math and literacy. When students use graphing to explore a story’s themes, they’re doing more than just counting. They’re analyzing characters, understanding plot, and making personal connections to the book.
The key is to use the graph as a storytelling tool. It becomes a visual map of the book’s world, whether you’re charting a character’s journey or tallying up different community traditions. This approach transforms a simple lesson plan for 2nd grade into a dynamic exploration of how numbers and narratives fit together.
Bridging Math and Literacy with Number 6 Books
The right book can turn a graphing exercise into an exciting new adventure. By tying data to compelling characters and plots, you help students see how math skills apply to the world all around them. Here are a few practical ideas using titles from Number 6 Publishing.
-
Graphing Traditions with Down Home: After reading this heartfelt story, students can survey their classmates about their own family traditions. They could then create a pictograph where each symbol represents something unique, like a special meal or holiday celebration. This not only reinforces graphing skills but also opens up a wonderful conversation about culture and community.
-
Mapping Travels with A Complicated Journey: The protagonist's travels offer a fantastic opportunity for a geography tie-in. Students can map out the character's journey on a real map and then create a bar graph showing the distance between locations or the time spent in each place. It’s a beautiful way to blend data representation with map-reading skills.
This type of integrated learning is incredibly powerful. It shows second graders that math isn't just a subject; it’s a language for understanding everything from family stories to exciting adventures. It turns abstract data into something tangible and meaningful.
Why This Approach Works So Well
Connecting data to stories helps make abstract concepts stick. For publishers like Number 6, integrating lesson plans into their storybooks—like graphing characters' adventures in a book such as A Complicated Journey—not only meets educational standards but genuinely sparks curiosity. It ensures 2nd graders grasp how data shapes real-world decisions, from cafeteria menus to global demographics. You can find more insights about using data in the classroom to get inspired.
This method also provides natural differentiation. Students can engage with the story on their own level while still practicing the core math skill of graphing. The goal is to create a vibrant classroom where learning flows seamlessly from one subject to the next, all sparked by the power of a good book.
Common Questions About Second Grade Lesson Planning
Even with a perfectly polished lesson plan, every teacher knows that the moment you're in front of the class, a few "what ifs" are bound to pop up. Being ready for those real-world questions is what separates a good lesson from a great one. Let's dig into some of the things that might come up when you try a new activity like our data and storytelling lesson.
It's totally normal to wonder how an activity built for a full classroom will work with a smaller group, or even just one student at home. And of course, keeping everyone on track and engaged is always top of mind. The good news? This lesson is incredibly flexible.
With just a few simple tweaks, you can make this data adventure fit your specific classroom like a glove. The heart of the lesson—collecting data, graphing it, and talking about what it means—stays the same no matter your class size. The goal is always to make learning stick, and to have a little fun while we're at it.
Adapting for Different Class Sizes
So, how can you make this work in a homeschool setting or with a very small group? This activity actually translates beautifully. When you don't have a whole class to survey, the world opens up for data collection.
- Family Survey: Students can easily poll family members about their favorite foods, movies, or weekend plans.
- Fictional Character Poll: A single student can get creative and "survey" characters from a book series they love. Imagine them asking, "How many dragons appear in this chapter versus how many wizards?"
- Home Census: You can also task them with a home audit. They could count and graph the number of books on each shelf, the colors of cars that pass the window in ten minutes, or the different types of plants in the backyard.
The real key is to connect the data collection to their immediate world. When a student graphs the different types of birds they see at their own feeder, the learning becomes deeply personal and far more memorable.
This approach ensures they're still practicing the core skills of using tallies and creating graphs, but in a context that makes perfect sense to them. The lesson's integrity is all there, just tailored to their unique environment.
Managing Fast Finishers and Pacing
We all have them—the students who finish the graphing activity in five minutes when you planned for fifteen. Seeing kids finish early isn't a classroom management headache; it's a fantastic opportunity for enrichment. The trick is to have a few engaging extension questions in your back pocket.
Challenge them to start thinking like real data scientists by writing down a few "I wonder" questions inspired by their graph. You might see things like:
- "I wonder why more people chose this character?"
- "I wonder what would happen if we surveyed first graders instead?"
- "I wonder if the results would be different if we voted for the funniest character?"
You could also challenge them to show the same data in a different way. Ask them to create a new pictograph where one symbol represents two votes instead of one. This is a brilliant way to subtly introduce the concept of scale, a critical skill they'll need for more advanced graphing in later grades.
Making Cross-Curricular Connections
How do you keep this from being "just a math lesson"? This lesson plan for 2nd grade is a natural springboard into other subjects. For writing, have your students draft a short paragraph explaining what their graph shows and why they think the results turned out that way. This is a fantastic way to build crucial skills in analytical and persuasive writing.
For social studies, you can kick off a discussion about how surveys and graphs are used in the real world—think community planning or even voting. You can also connect it to a book like Down Home and have students graph cultural traditions from the story. What a great way to open up a conversation about diversity and community right in your own classroom.
Here at Number 6 Publishing, we believe that the best stories spark a curiosity that lasts long after the final page is turned. We invite you to explore our collection of heartfelt children's books to find the perfect narrative to anchor your next great lesson. Find your next classroom favorite at https://www.number6publishing.com.